You may have experienced the situation where your ASP.NET Core application runs smoothly while developed on your PC and in Visual Studio, but encounters issues and fails to produce the desired results when published on IIS. In this circumstance, remote debugging is precisely what can be helpful.

How does Remote Debugger function?
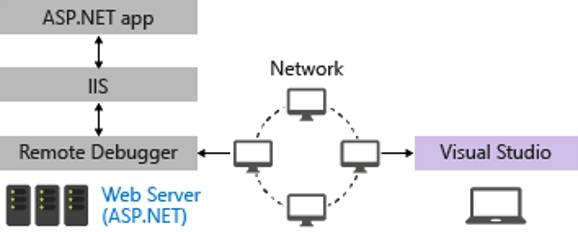
You can debug input requests to IIS through Visual Studio by using a remote debugger, which is positioned between IIS and Visual Studio and transmits queries from IIS to Visual Studio.

Before configuring Remote Debugger, please note the following considerations:
- Remote Debugger is not available if the IIS machine and Visual Studio machine are connected through a proxy.
- If the connection between the IIS machine and the Visual Studio machine has high latency or low bandwidth, then using Remote Debugger is not recommended.
Prerequisites
- Install Remote Debugger on IIS machine
- Check that the required ports are open in the firewall (by default, Port 4026 fot for Visual Studio 2022 or Port 4024 for Visual Studio 2019 and optionally UDP Port 3702 for discovery)
- The application should be deployed to IIS using Debug configuration
- The application deployed to IIS and the source code in Visual Studio should be exactly the same. Otherwise, the breakpoints in Visual Studio will not be hit.
How to Configure Remote Debugger?
1. Install Remote Debugger on the IIS machine. To install Remote Debugger, you can follow one of these two options:
If you have Visual Studio installed, then you can copy Remote Debugger from the Visual Studio installation path to the IIS machine. Remote Debugger usually is located in the following path: C:\Program Files\Microsoft Visual Studio\2022\Preview\Common7\IDE\Remote Debugger. If you have installed Visual Studio on other locations than the C:\Program Files, then you need to change the path respectively. Also, if you have installed Visual Studio other than the 2022 or Preview version, then the path should change respectively too.
Download the Remote Debugger and install it on an IIS machine. You can download the Remote Debugger from the following url: Download Remote Debugger
2. Suppose that we have followed the first option so in order to start the Remote Debugger on the IIS machine, double click on msvsmon.exe to run the Remote Debugger. After running the msvsmon.exe following window will be opened:

As it is shown in the following image, Remote Debugger is up and waiting for new connections through port number 4026. In the following image, VAHID-LEGION is the name of the IIS server. Now that we have Remote Debugger up and run. Next, we need to go to the Visual Studio and try to connect to Remote Debugger.
3. In Visual Studio, go to Debug>Attach to Process
4. In Connection target, enter the IIS machine address as specified in msvsmon.exe and click on find.

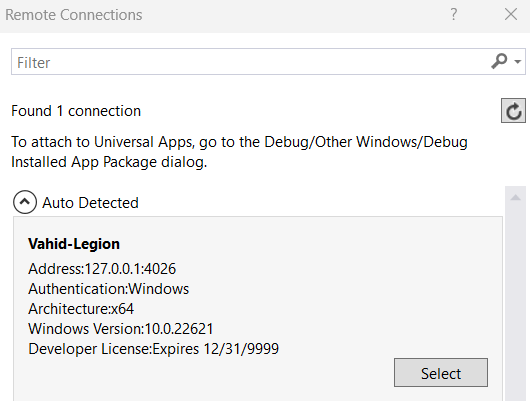
3. Remote Connections window will be opened. In this window, select the IIS Machine and the click on Select button.

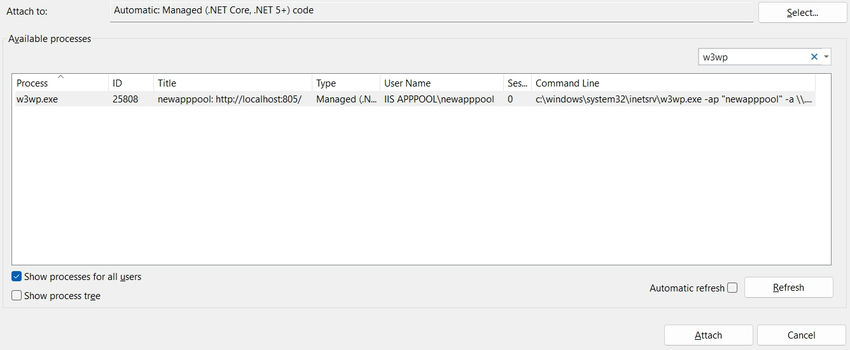
5. Wait until the connection is established and the process list is populated. From the process list, find the process associated with your website/web application in IIS. To easily find the process, you can enter w3wp in the search box to filter the process list. After finding the process on the IIS machine, select it and click on Attach.

6. If the Attach Security Warning window is shown, just click on Attach if you are sure to attach to the process.
7. Now, your website/web application on an IIS machine and your Visual Studio are connected to each other. You can now put a breakpoint in Visual Studio and start sending requests to IIS, to see that while processing the request, your breakpoints in Visual Studio are being hit.
Congratulation! you have successfully set up the Remote Debugger. But before you proceed, please note that you should not use this approach on production servers. because as you saw, breakpoints cause your application to be completely halted, and this can harm your application performance and usability. Just use this approach and similar approaches in test or staging environments.